SLUM MAPPING
.jpeg)
.JPG)
Problem:
-
The Act covers 109 municipalities in the state and ensures identified slum dwellers living in small towns have rights over up to 600 sq. ft of land while in the cities they will get rights over up to 450 sq. ft.
-
The Act and the programme come ahead of the assembly elections in the state stated before the summer of 2019.
-
Laws are made by politicians and works in the cities and implemented in faraway lands.
-
Likewise, the biggest challenge in the Odisha slum titling project was to verify the exact slum households in a given area and make land rights accordingly.
-
Manual surveys and mapping would have taken nearly a decade and the government wanted to hand over land titles by 2018.
A solution we provide with uniqueness:
Solution:-
-
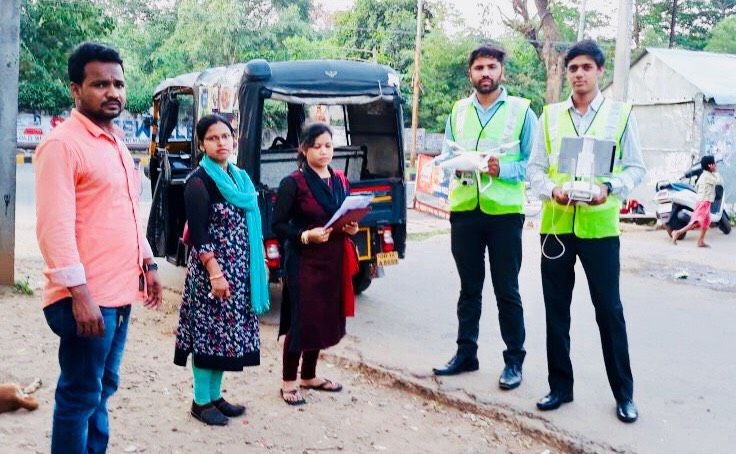
We provide drone solutions for ensuring both speed and accuracy.
-
We deploy a fleet of drones to map around 100,000+ slum households across the state.
-
We create maps with the best accuracy to clearly identify boundaries and even minute size of slums and blend that data with on-the-ground surveys about families residing in the slums.
-
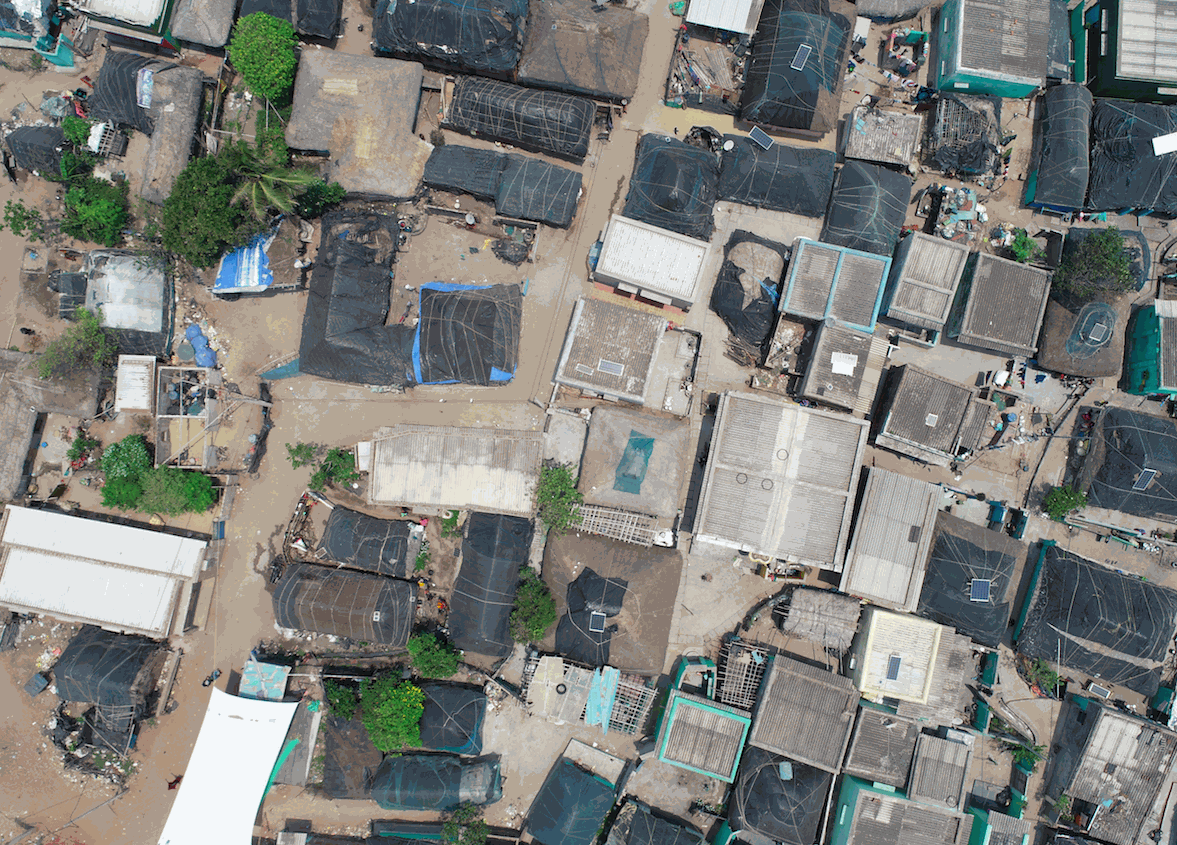
Pictures captured during each drone flight are processed as orthophotos, which are aerial photographs that have been geometrically corrected so that they have a uniform scale and can be used like regular maps.
Our Uniqueness:-
-
Our Precision mapping techniques using drone surveys help in identifying and creating space for creating a livable habitat.
-
Through Millimetre level mapping we help the administration carve out space for living amenities beyond just land.
-
We excel in providing better granular data, especially when it comes to highly populated settlements like slums where boundaries are difficult to be identified.
-
Our service team can cover a larger area in the same amount of time with good accuracy.
What We Deliver:-
-
Orthomosaics of individual slums located across each district in Geo.Tiff Format at 1cm/pixel accuracy.
-
Point clouds/3D Models with 2cm/pixel accuracy in Z for area planning such as a way to new roads, water pipelines etc.
-
Digital surface model with a cell size of 0.040m covering the entire slum area.
-
A quality report stating estimated accuracies and how quality was assessed.